Syndicate
Site Meter

Corn Falls Limit-Down
-May corn fell 20 cents today to $5.39 1/4 per bushel due to oil's steep decline. Oil slid $4.53 to $105.88 per barrel as the sale of Bear Stearns added fear to the current credit crisis. Ethanol's crush spread, however, fell also as April ethanol dropped 10.2 cents to $2.36 per gallon.
Ethanol Stocks Continue to Fall Fast
-Ethanol stocks plummeted today due to yesterdays news of corn shooting up 14 cents and Bush finally showing concern over corn-ethanol. VeraSun(9.03%) and Aventine(12.02%) hit new 52-week lows while Pacific Ethanol(10.90%) neared its own of $4.20 a share. Assisting the downfall was a report published today by the Wall Street Transcript which set a bleak outlook for ethanol this year. In the report, Pavel Molchanov of Raymond James & Associates stated "a typical ethanol producer will be at best breaking even this year and possibly losing money on the bottom line" due to what has been a persistent margin squeeze. March corn managed to stay unchanged today.
Ethanol's Crush Spread Plunges/Bush Praises Ethanol Yet Shows Concern
- The combination of March corn climbing 14 cents and March ethanol falling 4.6 cents caused ethanol's crush spread to drop 27 cents today to $1.02. Corn prices shot up as a result of oil's $5 run.
- Investors will be pleased to hear that President Bush renewed his support for ethanol today at the Washington International Renewable Energy Conference. Below is what he had to say:
"The vast majority of [our] ethanol is coming from corn, and that's good. That's good if you're a corn-grower. And it's good if you're worried about national security...Corn ethanol holds a lot of promise, but there's a lot of challenges. If you're a hog-raiser in the United States, you're beginning to worry about the cost of corn to feed your animals. I'm beginning to hear complaints from our cattlemen about the high price of corn. The high price of corn is beginning to affect the price of food...I look forward to the day when people in the parts of our country that have got a lot of forests are able to convert wood chips into fuel...The job of the federal government is to expedite [this] arrival."
Wow! Bush is finally expressing concern over corn-ethanol. That took him a while.
Ethanol Stocks Dive/Cellulosic Ethanol is Behind Schedule
-News of corn reaching an all-time high caused pure-play ethanol stocks to tumble today. VeraSun was the biggest loser as it dropped $1.18(13.21%) to a 52-week low of $7.75 a share. On the CBOT, March corn retreated 12.4 cents to $5.43 per bushel (on profit-taking) while March ethanol dropped only .001 cent to $2.400 per gallon.
-Guy Caruso, the head of the EIA, stated today that "quantities of cellulosic ethanol prior to 2024 will be insufficient" to meet the 36 billion gallon requirement as there has yet to be an efficient way of production. Cellulosic ethanol is responsible for contributing nearly half of the mandate. Caruso estimates that only 32.5 billion gallons will be reached by the target date. Good news, though, is that the USDA and DOE announced today that they will invest up to $18.4 million in several projects aimed at improving the process. It is important that we get such funding as Ethanol will not last if we cannot produce it cellulosically.
Corn Continues Bullish Push
- Corn continued its push into uncharted territory today as March corn on the CBOT settled 9.4 cents higher to $5.55 per bushel. The rise was due to spillover support from soybeans, crude oil, silver and gold. The cost for corn has recently become a much greater problem for ethanol producers as VeraSun - at its Aurora plant - bought its corn today for a frightening $5.33 per bushel. Ethanol futures, however, managed to overshadow the record-setting gain by climbing 4.1 cents to $2.401 per gallon (Remember: 1 gallon of ethanol = 2.8 bushels of corn).
Corn Skyrockets/Verenium Wins Grant
- March Corn shot up 18 1/4 cents today to $5.43 1/4 per bushel. The rise was due to a record setting rally by both gold($975 per ounce) and oil($102.59 per barrel) as the U.S. dollar fell to a record low against the Euro Jogos casino online. Ethanol on the CBOT managed to rise 3.9 cents to $2.359 per gallon. After today's trading, ethanol's crush spread has fallen to $1.17.
| Date | CBOT ethanol price | CBOT corn price | Crush spread |
| February 28th | $2.36 | $5.43 | $1.17 |
| January 2nd | $2.42 | $4.62 | $2.15 |
| December 18th | $2.13 | $4.32 | $1.66 |
| December 15th | $2.08 | $4.38 | $1.44 |
| November 19th | $1.81 | $3.94 | $1.12 |
| October 16th | $1.61 | $3.74 | $.77 |
| September 1st | $1.54 | $3.69 | $.62 |
-Verenium Corporation (VRNM) was awarded today one of the four grants available by the U.S. Department of Energy to "develop improved enzyme systems to convert cellulosic material into sugars suitable for the production of ethanol." Verenium will receive a nice slice of the $33.8 million available. Earlier in the year, Pacific Ethanol received a similar grant of up to $24.3 million to build a small-scale demonstration plant that will make ethanol out of wood chips.
Taxing Big Oil/Ethanol Fires/Cargill Suspending Operations
-The House approved an $18 billion tax package today that would repeal a tax break for the country's five largest oil companies. The money, which would be collected over 10 years, would be used to provide tax breaks for alternative energy sources such as wind, solar, and cellulosic ethanol. President Bush, though, is expected to veto the bill if it passes Congress. This is odd considering Bush was the one who stated two years ago - when oil was at $55 a barrel - that oil companies no longer need government subsidies. With oil currently hovering around $100 a barrel and oil companies reporting record profits, why is Bush threatening to veto? Republicans are worried the new tax "would inhibit investments in domestic oil and gas exploration and production." Oh, Please!
-Another problem has been added to ethanol's list: Ethanol fires are harder to put out than gasoline ones as water cannot be used and a special type of firefighting foam is required. This is a foam that many fire departments in the country don't have and is 30% more expensive than the conventional foam used for gasoline fires.
- Cargill announced today that it will suspend construction on its 100 million-gallon-per-year ethanol plant in Kansas due to high corn prices.
Ethanol-Pipelines Soon to Come?
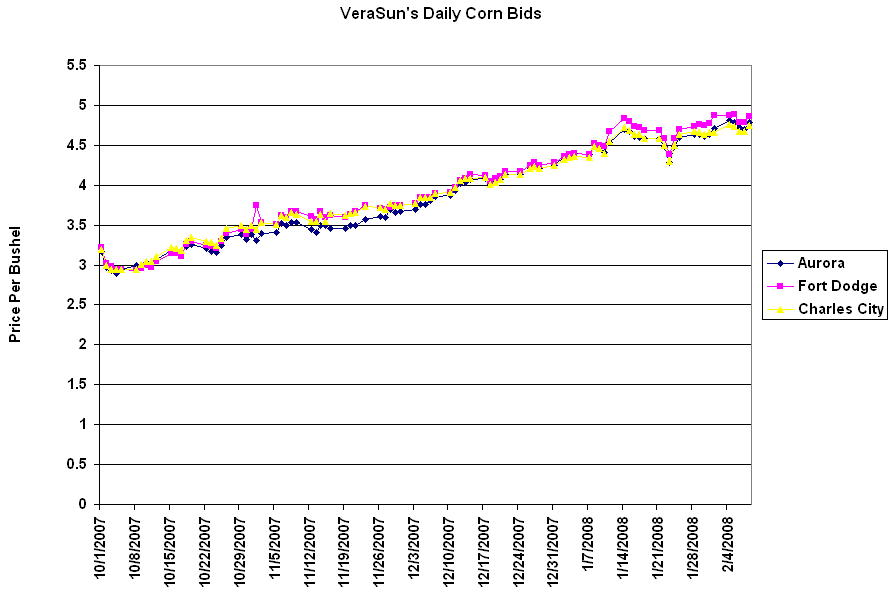
The Price VeraSun Pays For Its Corn
Ethanol Doesn't Get Usual Attention in State of the Union Address
The President did manage, however, to propose a $2 billion fund that would be disbursed over the next three years to help developing nations purchase alternative energy technologies. This is a small amount, however, considering China alone is investing over $100 billion a year on alternatives such as coal-fired electricity.
Ethanol Stocks Up Big Before State of the Union Address
Oil's True Energy Balance
Rough Week for Ethanol Stocks
| Date | CBOT ethanol price | CBOT corn price | Crush spread |
| January 11th | $2.21 | $4.95 | $1.18 |
| January 2nd | $2.42 | $4.62 | $2.15 |
| December 18th | $2.13 | $4.32 | $1.66 |
| December 15th | $2.08 | $4.38 | $1.44 |
| December 10th | $1.88 | $4.17 | $1.09 |
| November 19th | $1.81 | $3.94 | $1.12 |
| October 16th | $1.61 | $3.74 | $.77 |
| September 1st | $1.54 | $3.69 | $.62 |
Corn Hits 12-Year High
| Date | CBOT ethanol price | CBOT corn price | Crush spread |
| January 2nd | $2.42 | $4.62 | $2.15 |
| December 18th | $2.13 | $4.32 | $1.66 |
| December 15th | $2.08 | $4.38 | $1.44 |
| December 10th | $1.88 | $4.17 | $1.09 |
| November 19th | $1.81 | $3.94 | $1.12 |
| October 16th | $1.61 | $3.74 | $.77 |
| September 1st | $1.54 | $3.69 | $.62 |
Investors Enjoying Ethanol's Recent Success
| Date | CBOT ethanol price | CBOT corn price | Crush spread |
| December 18th | $2.13 | $4.32 | $1.66 |
| December 15th | $2.08 | $4.38 | $1.44 |
| December 10th | $1.88 | $4.17 | $1.09 |
| November 19th | $1.81 | $3.94 | $1.12 |
| October 16th | $1.61 | $3.74 | $.77 |
| September 1st | $1.54 | $3.69 | $.62 |
Corn, which is trading at a very high price right now, is expected to trade lower in the coming days due to profit taking. With ethanol's recent success and favorable environment, it continues to be an appealing short term play. Since November 20th, Pacific Ethanol has jumped 73%, VeraSun 58% and Aventine 49%.
Ethanol Profitability Rising
Corn Prices Highest Since June
| Plant Name (Company) | Yesterday's Corn Bid | Today's Corn Bid |
| Aurora Plant (Verasun) | $3.87 | $3.93 |
| Fort Dodge Plant (Verasun) | $3.91 | $3.97 |
| Charles City Plant (Verasun) | $3.91 | $3.97 |
| Iowa Falls Plant (Hawkeye) | $3.99 | $4.04 |
| Fairbanks Plant (Hawkeye) | $3.88 | $3.94 |
| Iroquois Plant (Iroquois Bio-Energy) | $3.98 | $4.04 |
| Redfield Plant (Redfield Energy) | $3.86 | $3.91 |
| Glacial Plant (Glacial Lakes Energy) | $3.85 | $3.91 |
Pacific Ethanol announced yesterday that it has suspended construction of its Imperial Valley ethanol plant in part due to rising corn prices.
Today's Ethanol Recap
December Ethanol on the CBOT increased once again to settle at $1.968 a gallon. CBOT Ethanol has jumped approximately 40 cents since hitting its all-time low back in October. Investors should keep an eye out for ethanol stocks as conditions have become moderatly favorable. Morgan Stanley's analyst, Dave Wilson, recently issued a short-term buying opportunity with share prices so low.
In other news, Aventine's CEO, Ronald H. Miller, bought 10,000 shares of his own company's stock at $8.54.
What to look forward to:
The U.S. House of Representatives could vote on a wide-ranging energy bill next week that would triple the use of ethanol. There is speculation that legislation will require 20.5 billion gallons of ethanol by 2024, with 5.5 billion gallons of that coming from cellulosic ethanol. The bill is also speculated to set short-term targets of 9.5 billion gallons by 2024 and 11.6 billion gallons by 2024. Back in June, the Senate passed a proposal to require 36 billion gallons of ethanol use by 2024. Democrats will also attempt to hit the oil industry with $15 billion in taxes and require utilities to get 15 percent of their electricity from wind, solar and other renewable sources.
John Deere Posts Impressive Fourth Quarter Earnings
Corn Settles Higher on Rising Oil
| Plant Name (Company) | Yesterday's Corn Bid | Today's Corn Bid |
| Aurora Plant (Verasun) | $3.41 | $3.46 |
| Fort Dodge Plant (Verasun) | $3.59 | $3.62 |
| Charles City Plant (Verasun) | $3.55 | $3.64 |
| Iowa Falls Plant (Hawkeye) | $3.60 | $3.64 |
| Fairbanks Plant (Hawkeye) | $3.63 | $3.68 |
| Iroquois Plant (Iroquois Bio-Energy) | $3.61 | $3.65 |
| Redfield Plant (Redfield Energy) | $3.43 | $3.47 |
| Glacial Plant (Glacial Lakes Energy) | $3.43 | $3.48 |
Since all the major pure-play ethanol producers have posted their third quarter results, let's see how they faired with corn costs.
| Company | Third Quarter Corn Costs | Second Quarter Corn Costs |
| Pacific Ethanol | $4.54 per bushel | $4.23 per bushel |
| VeraSun | $3.32 per bushel | $3.62 per bushel |
| US BioEnergy | $3.15 per bushel | $3.97 per bushel |
| Aventine | $3.79 per bushel | $3.99 per bushel |